Plastic Pollution and GDP Patterns Across East & Southeast Asia
The plastic waste crisis is a significant issue in the prevention of Global Warming. Countries in East and Southeast Asia are among the largest producers of plastic waste, a trend that aligns with their rapid economic growth. While some countries in the region have established recycling systems to reduce waste, others still face challenges with poorly managed waste and insufficient infrastructure.
As international attention increasingly focuses on climate action and waste management, this topic carries strong news values of timeliness, impact, and magnitude. The health of humans, animals, plants, and the environment are interconnected. By analyzing waste trends and their connection to national GDP, we can identify strategies to help reduce plastic waste and combat global warming. The analysis is based on datasets from Our World in Data and the World Bank, utilizing verified information on plastic waste production and GDP per capita.
Why compare East Asia vs. Southeast Asia:
The regions in East and Southeast Asia share a common characteristic of rapid growth and rising consumption, yet differ significantly in institutional capacity and recycling infrastructure. Comparing these countries will clarify how their varying stages of economic development contribute to differences in waste-management outcomes and expose specific environmental vulnerabilities across the region.
Questions to Answer
- How much plastic waste has been generated per person/kg/day in each country in East and Southeast Asia?
- Which countries in East & Southeast Asia produced the highest levels of plastic waste, and how did the pattern change from 2010 to 2019?
- To what extent is there a correlation between a country’s GDP per capita and its plastic waste emission?
Data Sources
- Per-capita plastic waste (kg/person/day) data
- Source: Our World in Data (OWID). OWID compiles global environmental and consumption indicators using peer-reviewed academic studies and internationally reported statistics.
- Size: 186 rows and 4 columns
- Key variable: This dataset provides statistics on the amount of plastic waste (kg) generated per person per day across different countries.
- Regional plastic waste data
- Source: Our World in Data.
- Size: 200 rows and 7 columns
- Key variable: For this specific dataset, the total plastic waste emission data are sourced from OECD.
- GDP data
- Source: World Bank Group (WBG). WBG provides standardized, annually updated economic indicators for all countries.
- Size: 266 rows and 70 columns
- Key variable: This dataset provides GDP statistics for each country from 1960 to 2024.
Summary of Findings
High-income countries such as Singapore and Japan shows a high level of plastic waste emission (kg/person/day)
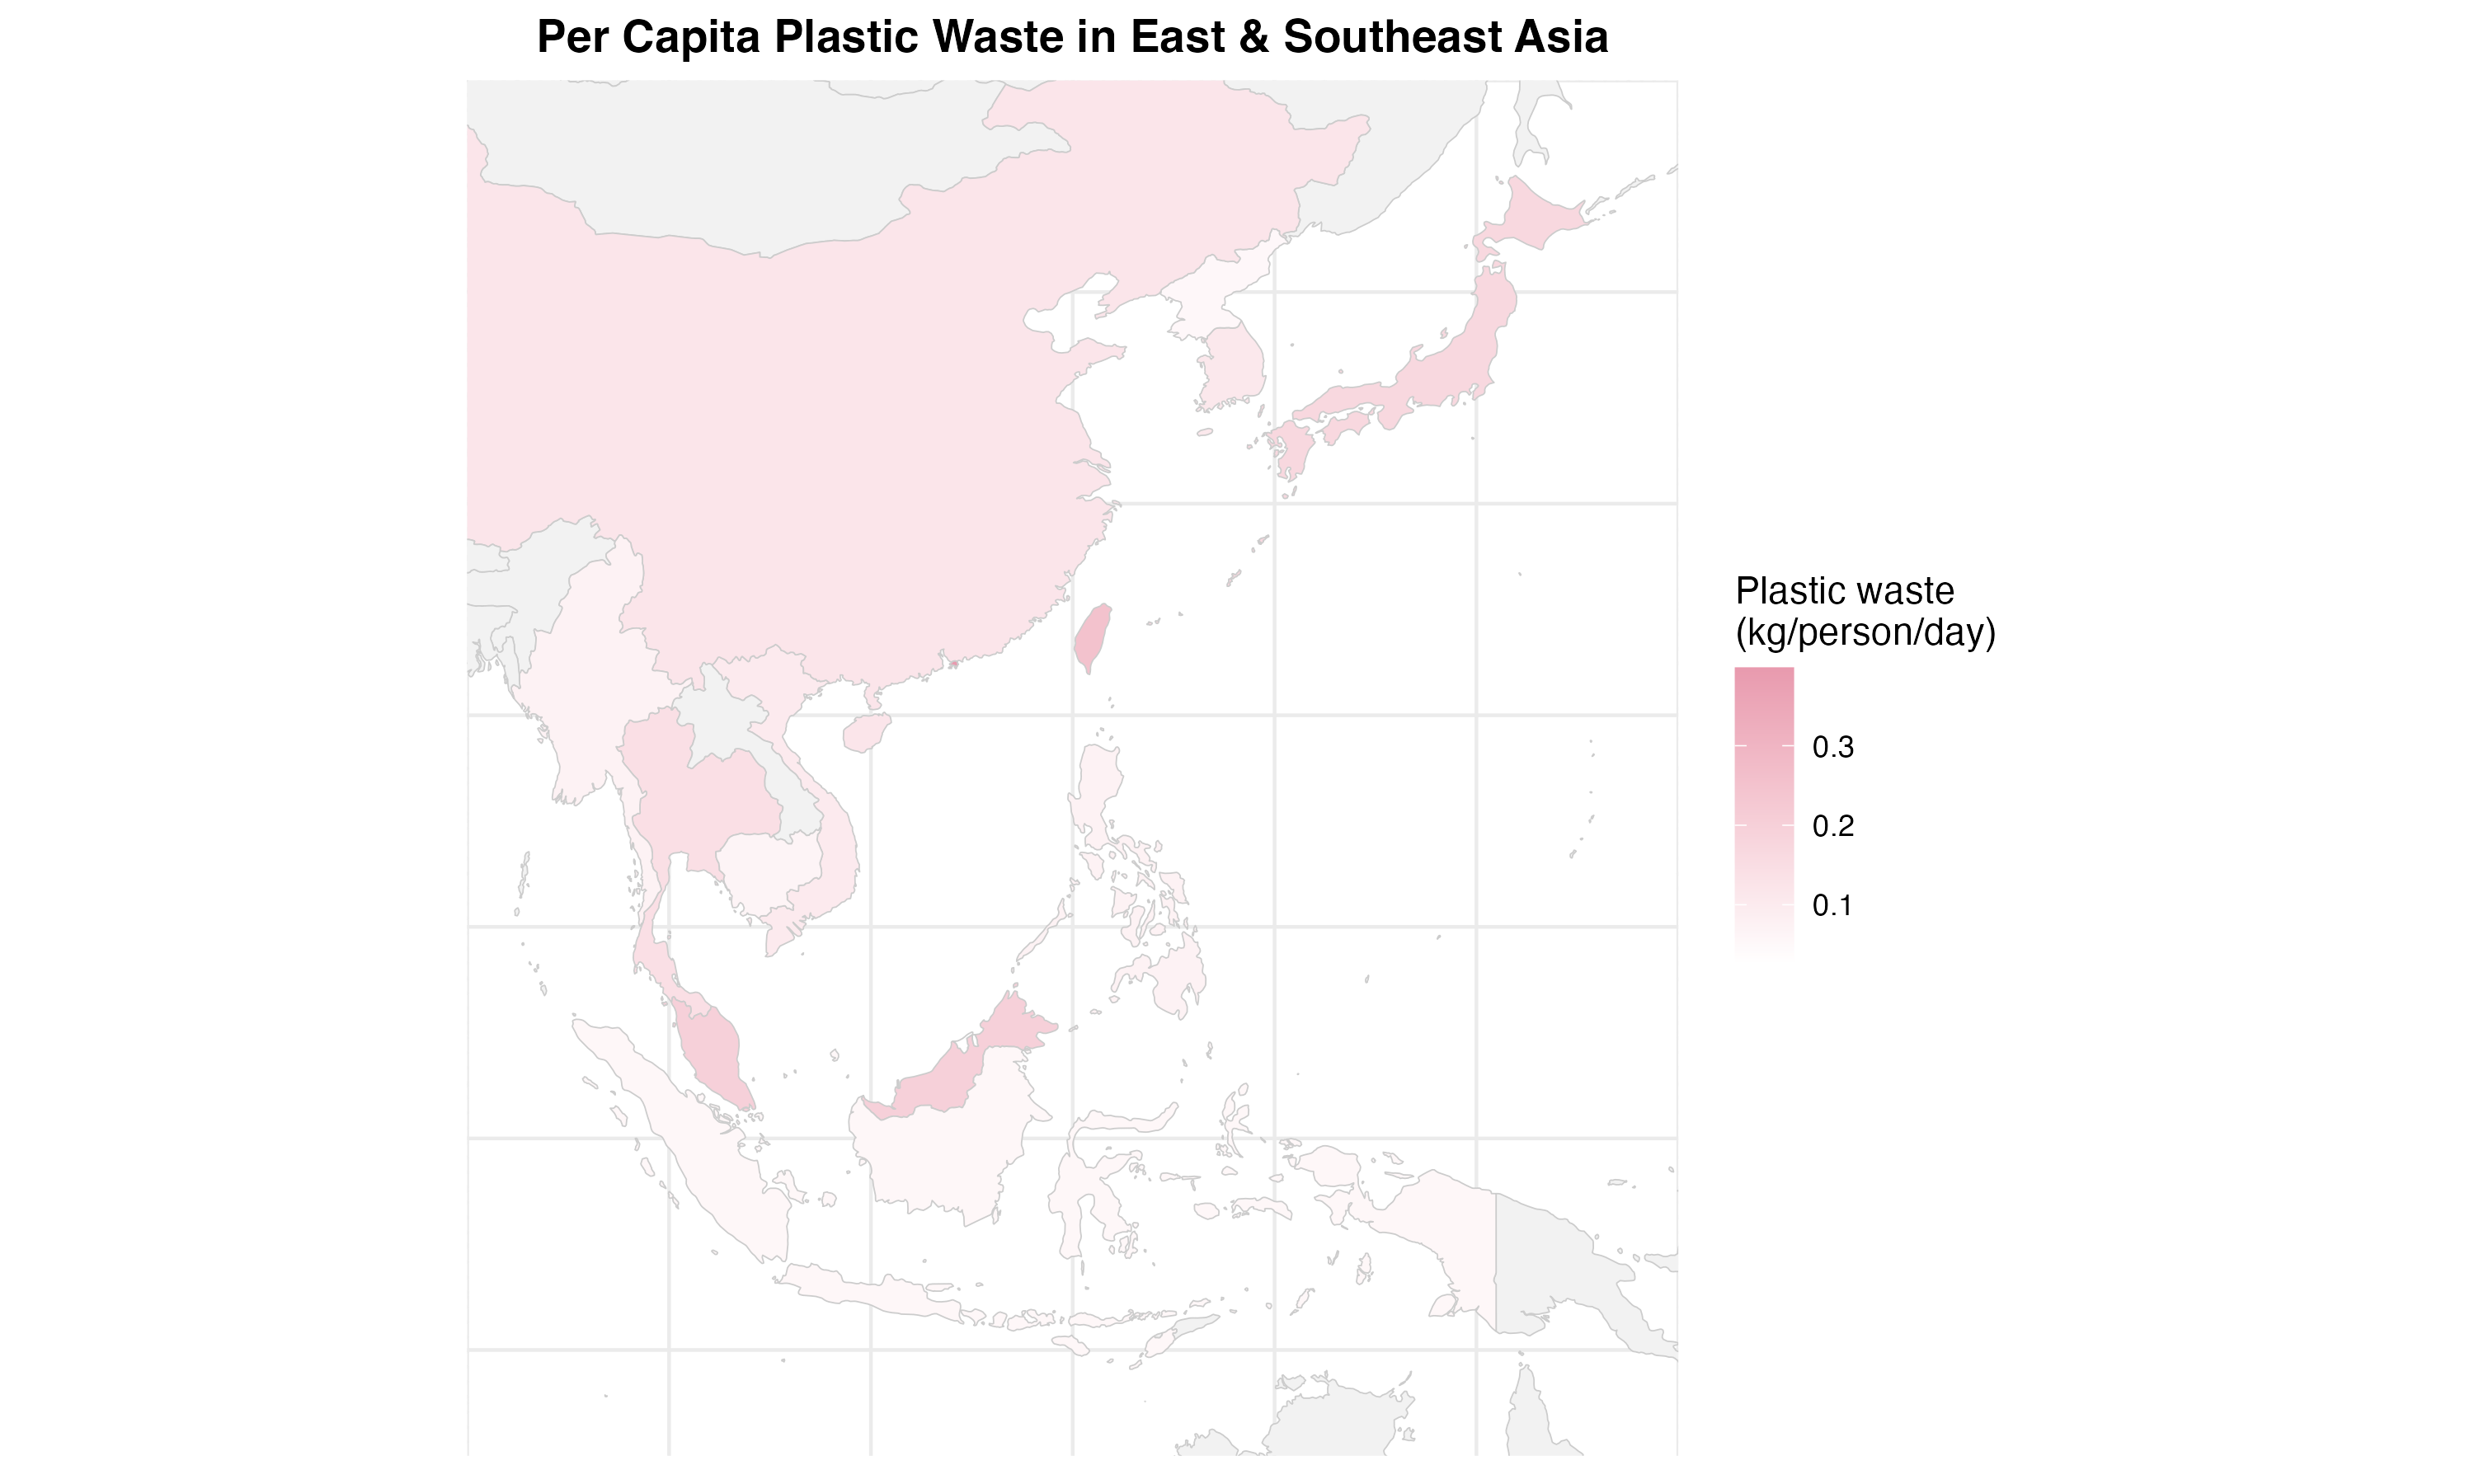 Map - Geographical pattern of plastic waste
This map reveals geographical patterns of plastic waste emission (kg/person/day) in East and Southeast Asia. High-income countries such as Singapore and Japan stand out with slightly higher levels of daily plastic waste per person than other low-income countries, such as Cambodia and Indonesia. In particular, Taiwan, Malaysia, and Singapore show a high level of plastic waste, as indicated by the dark colors on the map, compared with the lighter-colored countries.
In correlation with economic factors, wealthier, more urbanized economies such as Japan, South Korea, Singapore, and Hong Kong are shown to generate more plastic waste per person. Meanwhile, developing Southeast Asian nations tend to produce less per capita but are still major contributors in total volume due to larger populations. Overall, the map highlights the relationship between economic development and plastic waste intensity, while also emphasizing that countries with lower per-capita waste may still face significant waste-management challenges due to rapid population growth and weaker infrastructure.
Note: Some countries may not have any data reports in OWID’s data set, which explains why some countries appear in gray-colored spaces. Also, the data set measures plastic waste (kg) per person per day, so the results may differ from the total plastic waste generated by a country.
Hong Kong has the highest rate of plastic pollution, followed by Taiwan and Malaysia.
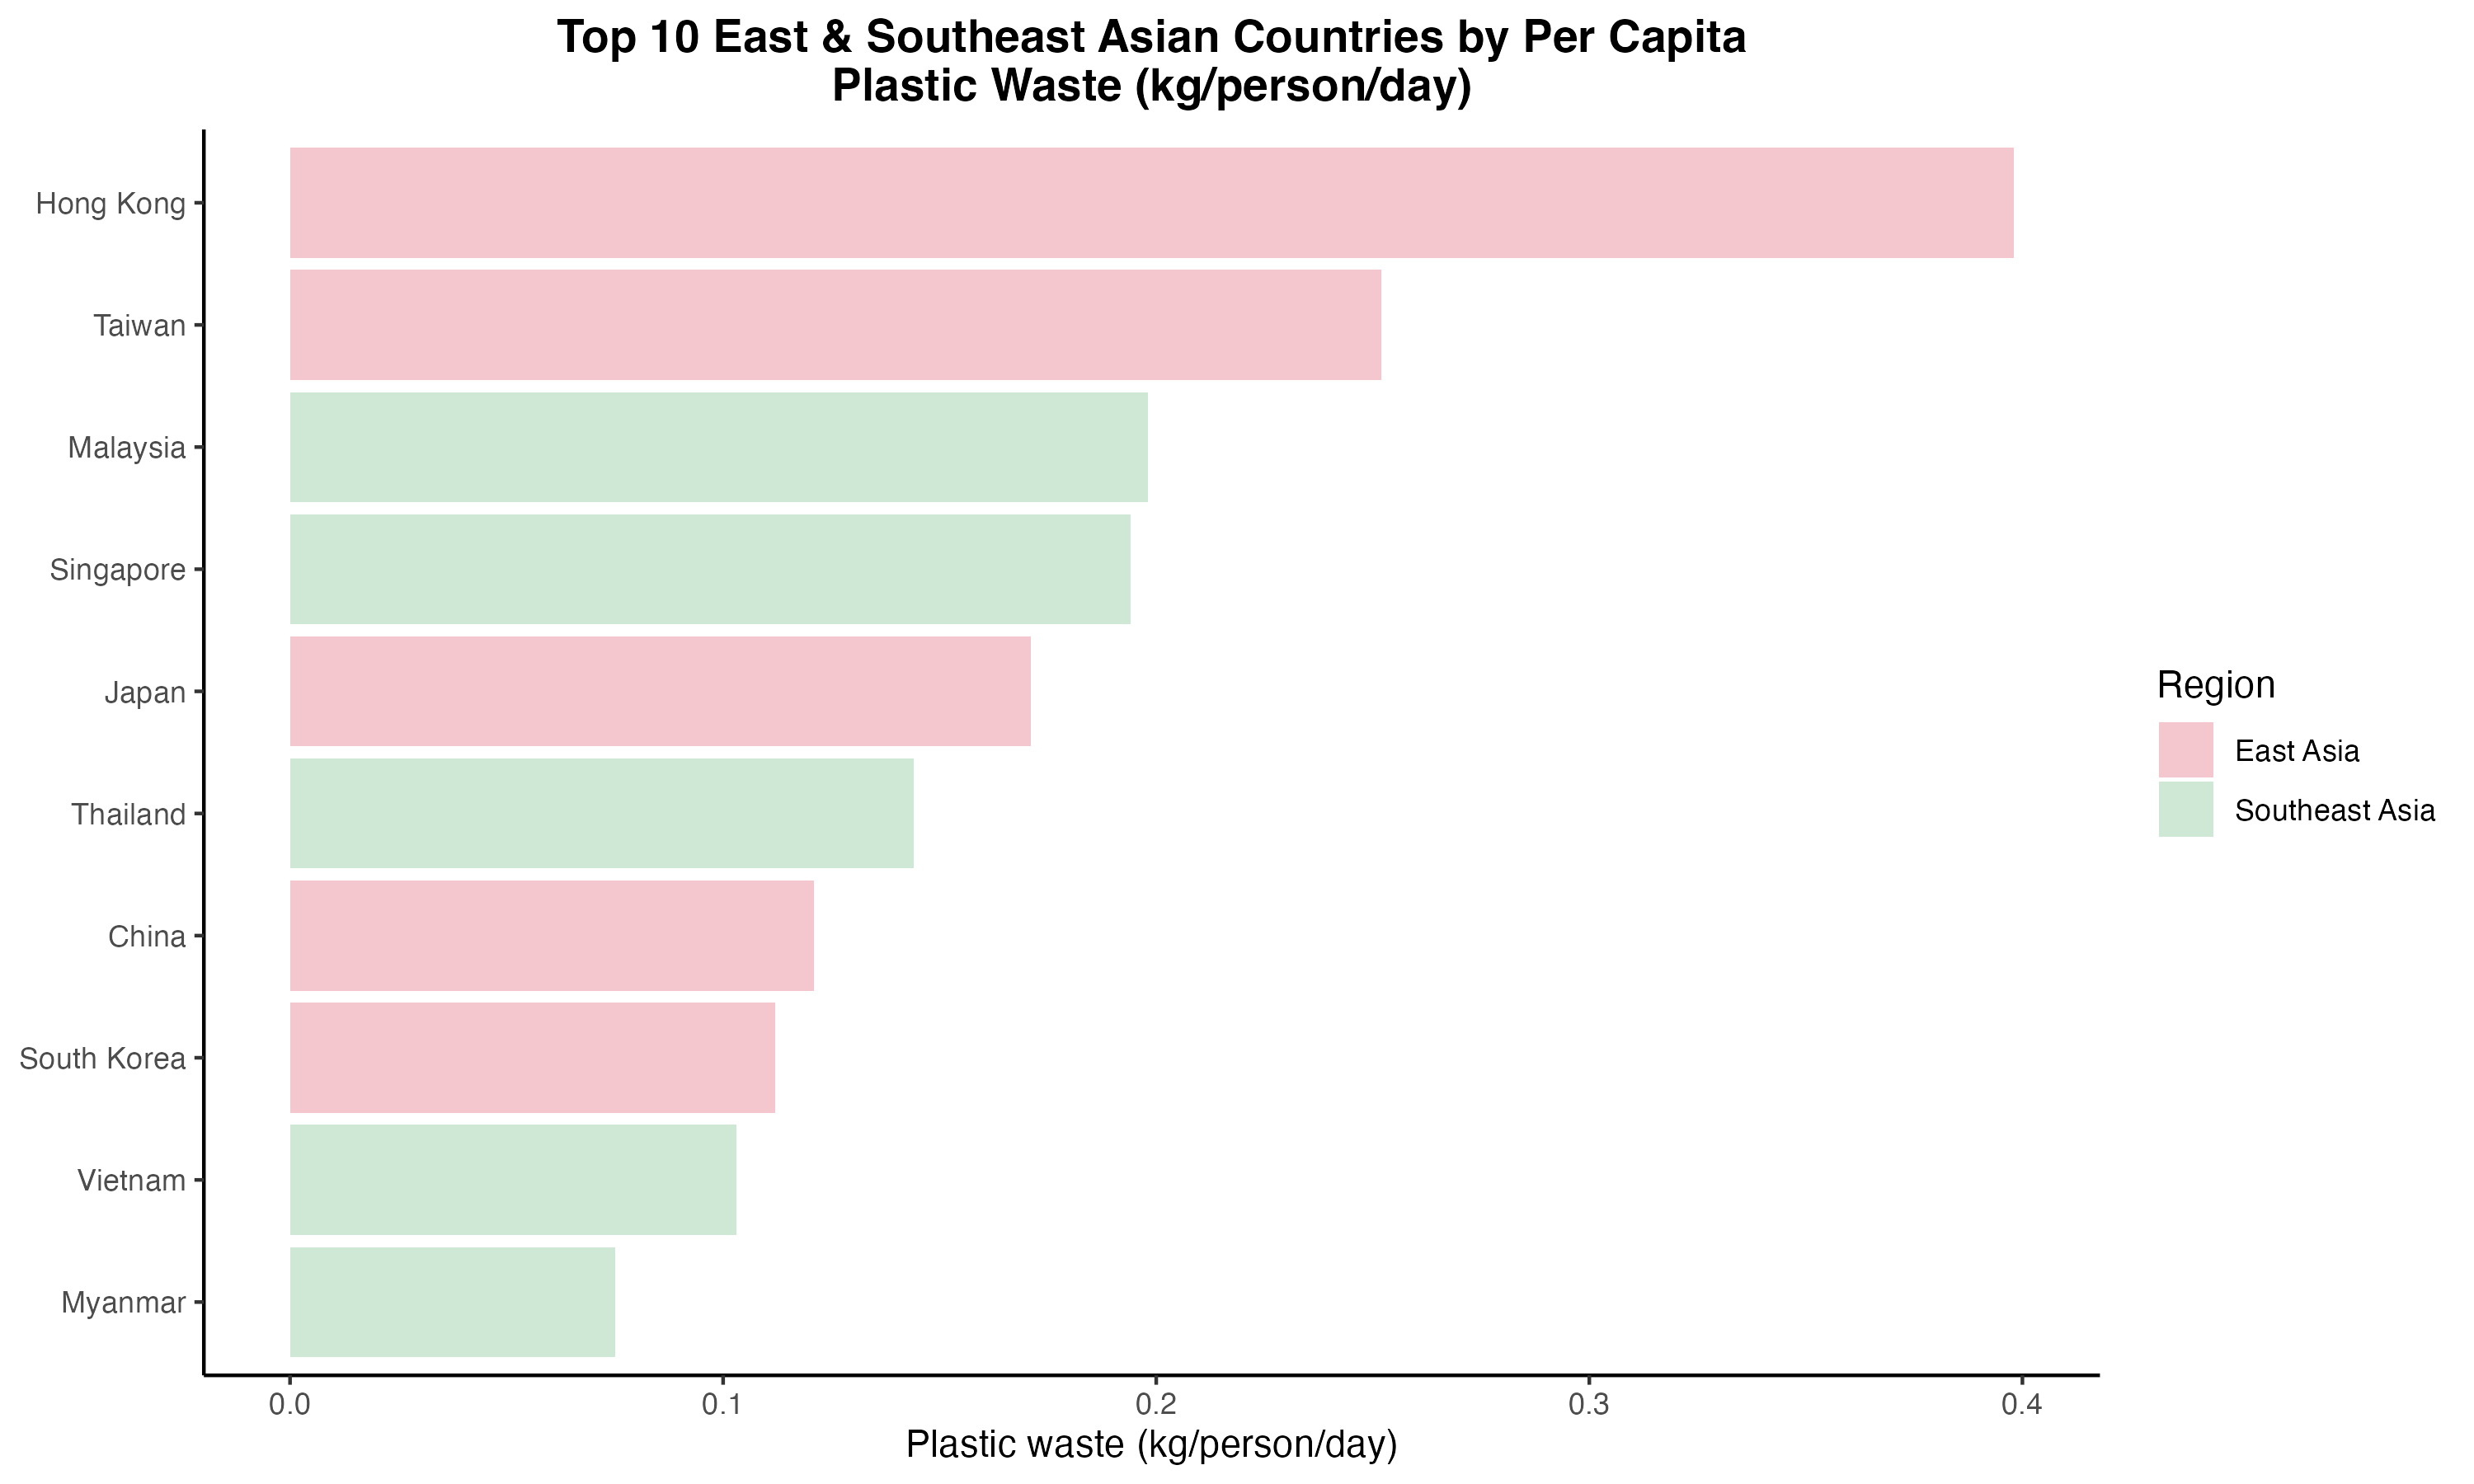 Bar chart – Top 10 plastic waste–producing countries (per capita)
Hong Kong recorded the highest per capita plastic waste at 0.398 kg/person/day, significantly higher than in any other economy in East and Southeast Asia. Taiwan ranked second-highest with 0.252 kg/person/day, while Malaysia and Singapore also showed relatively high per-capita waste levels.
The number of East Asian and South Asian countries on the top 10 plastic waste producers list was roughly equal, with East Asian countries (Hong Kong, Taiwan, Japan, South Korea, China) slightly ahead. This shows that high-income, urbanized territories such as Hong Kong, Taiwan, and Singapore tend to generate more plastic waste per resident. These patterns may reflect higher consumption levels, greater packaging use, and denser metropolitan lifestyles than those of their Southeast Asian counterparts.
Asia (excluding China and India) and India’s plastic waste emission increased at a steady rate annually, while China’s declined from 2015 to 2018 after peaking around 2014 and 2015.
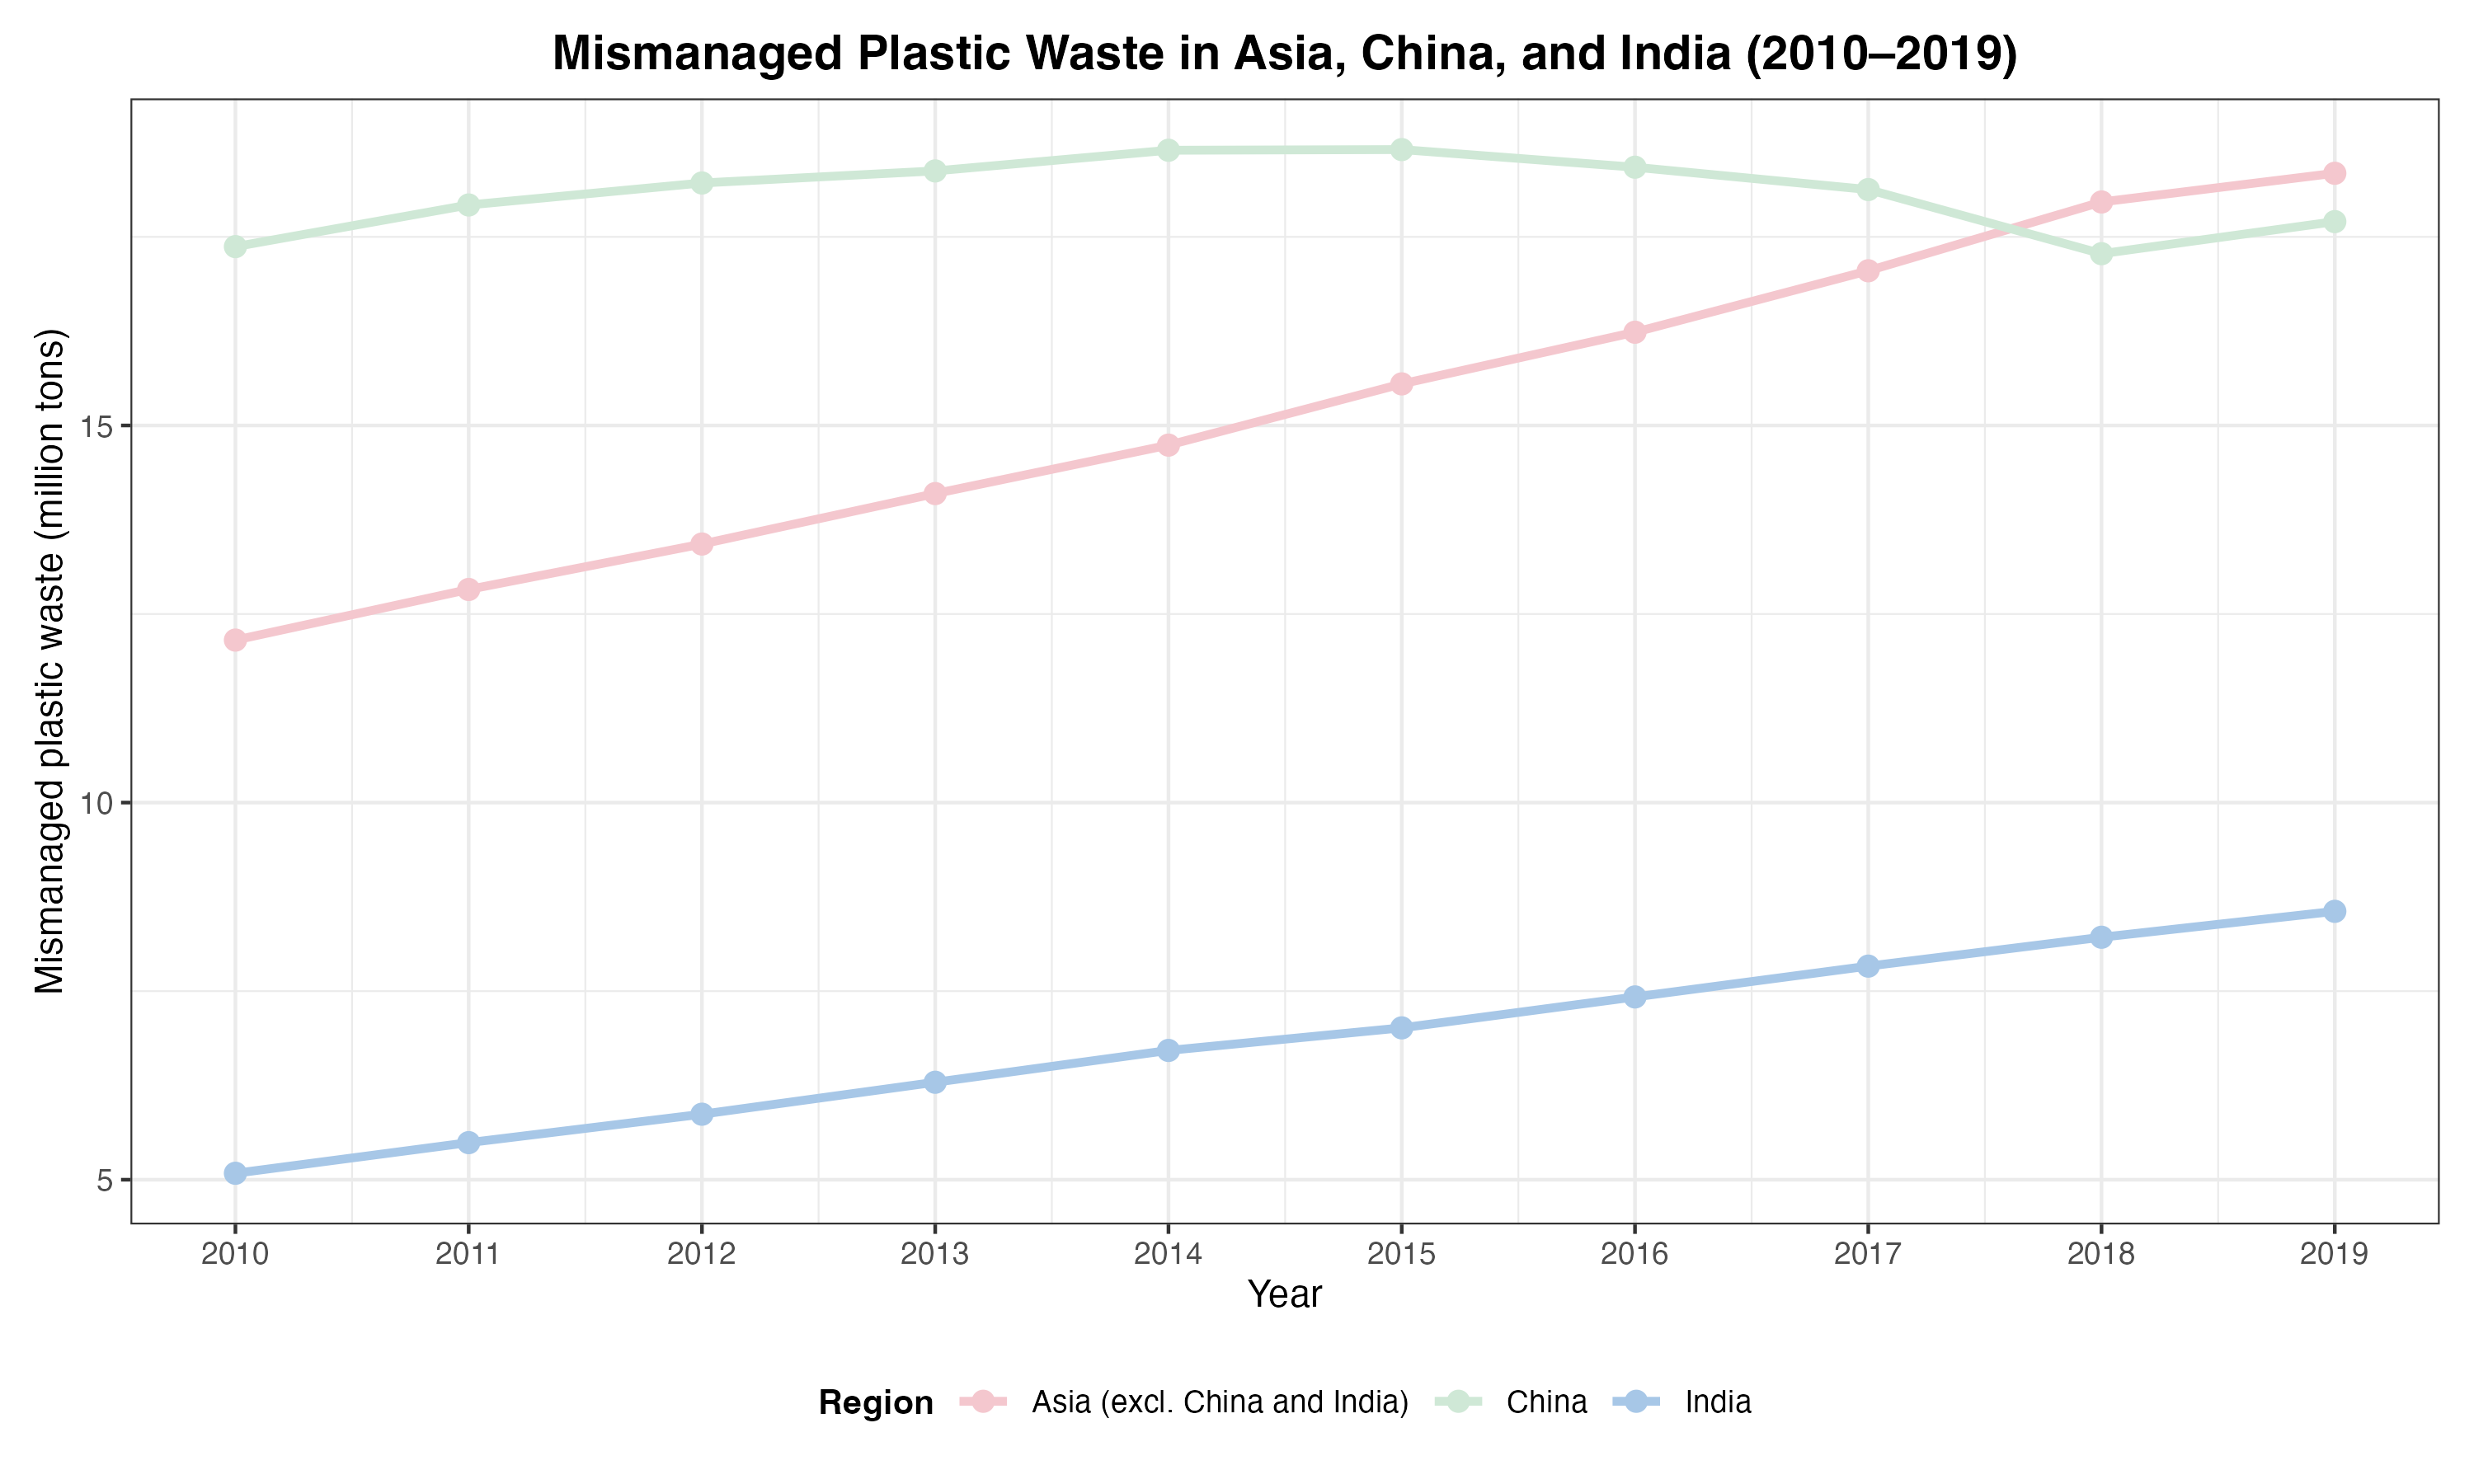 Line chart – Plastic waste trends for Asia (excl. China & India), China, and India (2010–2019)
Asia (excluding China and India) ’s total plastic waste emissions show a steady increase from 2010 to 2019, rising from about 12 million tons in 2010 to nearly 18 million tons in 2019. In contrast, China’s plastic waste emissions peaked around 2014 and 2015 at about 18.5 million tons and declined thereafter until 2018. India also shows a clear upward trajectory over the decade, rising from 5 million tons to nearly 9 million tons, though its total plastic waste emissions remain significantly lower than those of China and Asia.
Together, the trends illustrate that although China had successfully stabilized or reduced its plastic waste levels between 2015 and 2018, the broader Asian region continues to face escalating pressures.
Note: China’s decline in plastic waste emission could’ve been due to the National Sword Policy that limited waste imports. This shows an attempt to address the environmental issue that had been overwhelming its country.
There was a positive relationship between a country’s GDP and its plastic waste emissions.
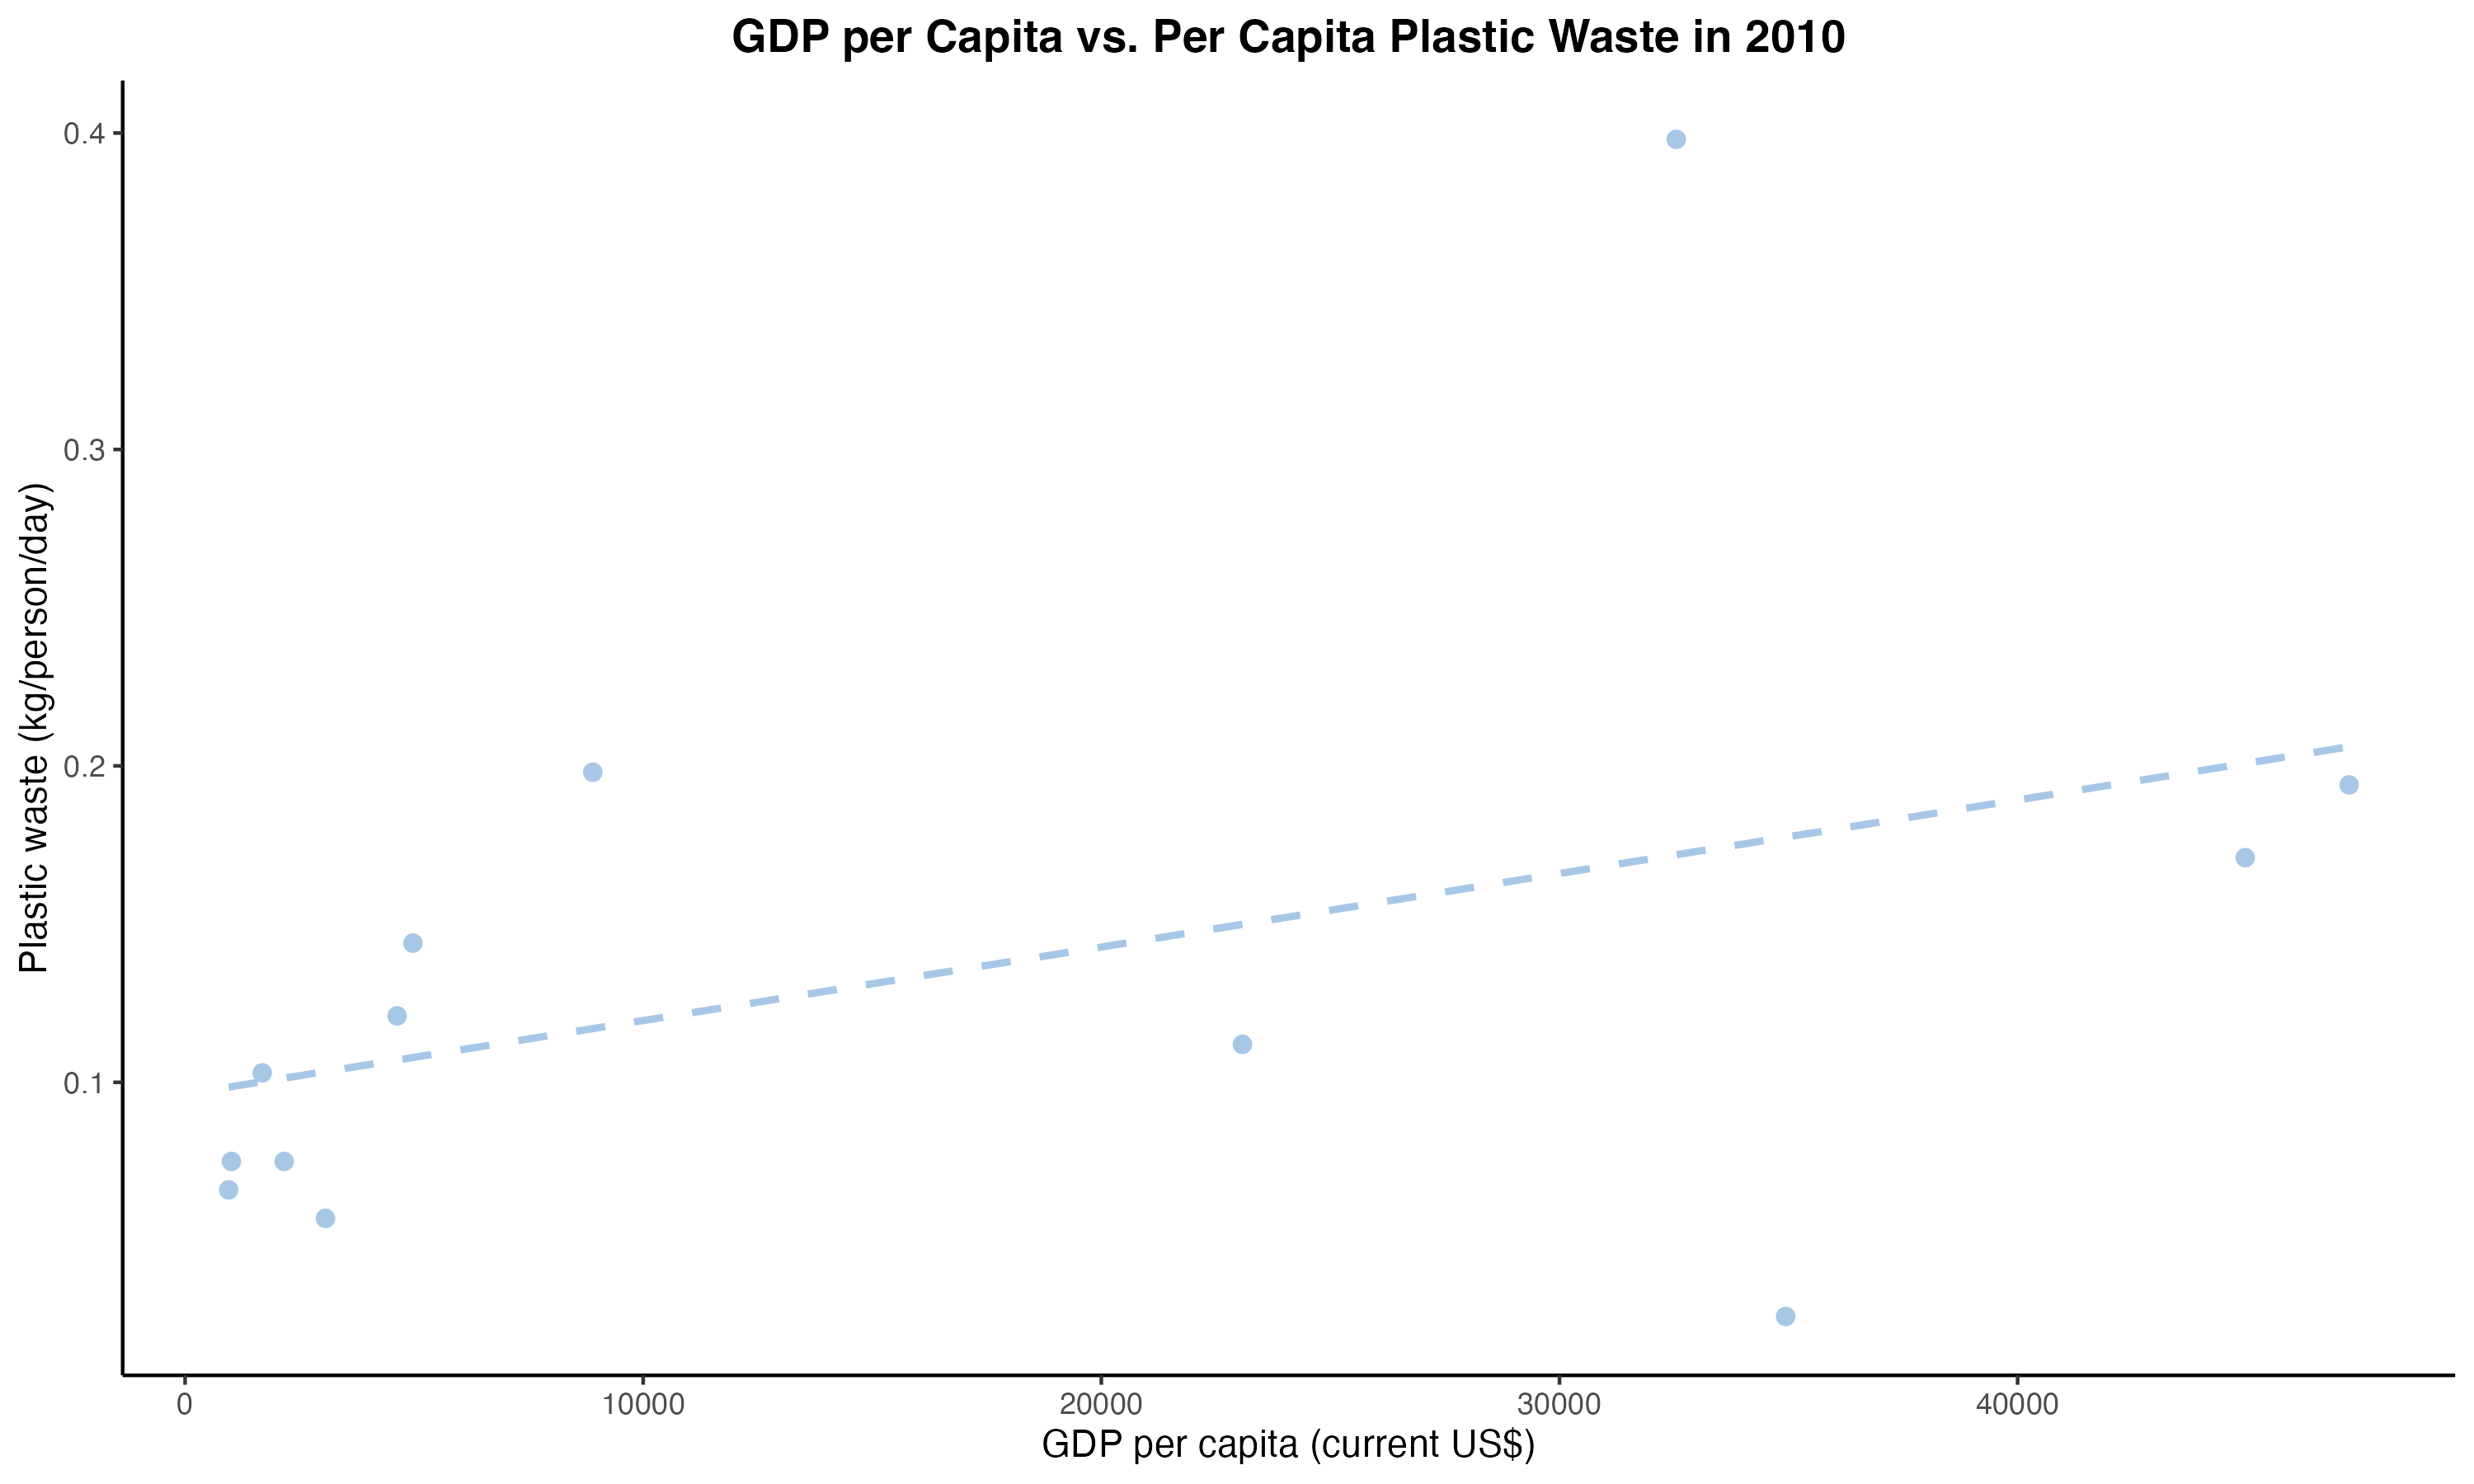 Scatter plot - Correlation between GDP per capita and plastic waste
The scatter plot shows a positive relationship between GDP per capita and per capita plastic waste generation in East and Southeast Asia. Wealthier economies with higher GDP tend to produce substantially more plastic waste per person, while lower-income countries with relatively low GDP tend to cluster at the lower end.
However, the relationship is not perfectly linear, as there are some outliers, such as Hong Kong. They produce an extraordinarily high level of plastic waste but have a moderately high GDP. This pattern suggests that economic development increases consumption and packaged-goods use, which might have led to higher levels of plastic waste emissions, in addition to waste policies and urban density. To address climate-related issues caused by plastic waste emissions, relevant environmental movements should be established in the highest-emitting countries.